
A Smarter Way to Manage Research Projects
Amytis helps researchers integrate, organise, and connect their research data effortlessly – all in one intuitive workspace.
Demo Video
Watch our demo video to find out all the ways the Amytis workspace could revolutionise the way you work and research.
Features
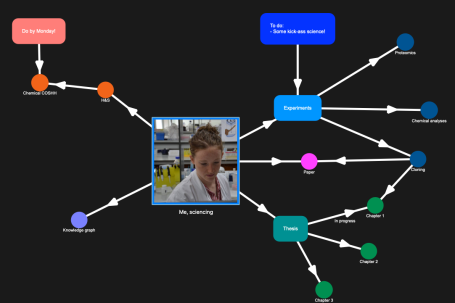
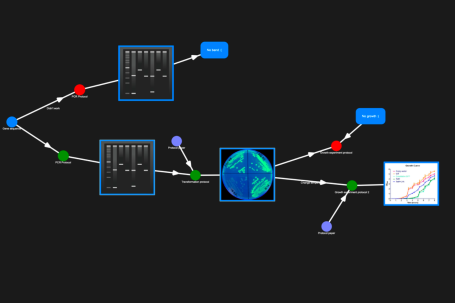
Visual Knowledge Mapping
See the Bigger Picture of Your Research
Amytis replaces rigid folders & linear text logs with a flexible graph-based workspace
Link experiments, papers, protocols, datasets & results in a dynamic research map
Effortlessly navigate and connect all aspects of your project
Integrated Data Management
All Your Research in One Place
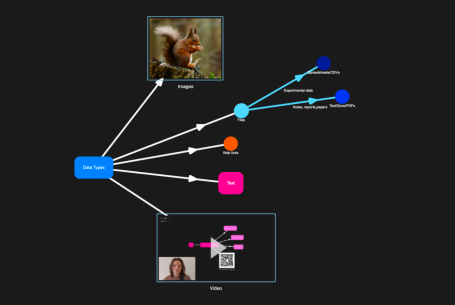
Attach any file type (PDFs, datasets, spreadsheets, images, videos)
Double-click to open files instantly in default applications
No more digging through messy folders or losing critical documents
Rich Text and Annotation Tools
Record Notes, Ideas, and Insights Directly in Your Workspace
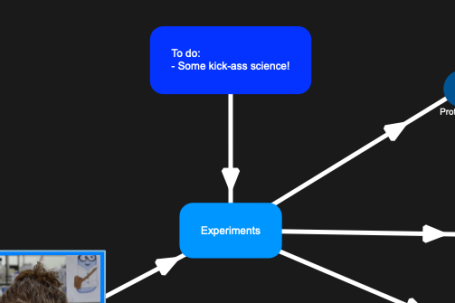
Create Text Nodes to write notes, reminders, to-do lists and summarise findings.
Edit, colour-code & organise notes visually to keep your research structured
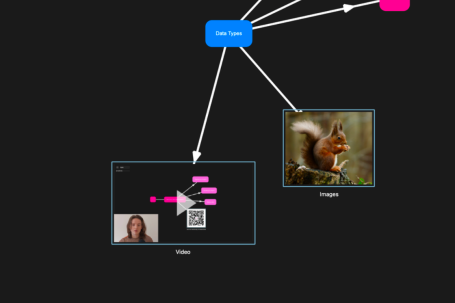
Image & Video Integration
Visualise Your Data More Effectively
Embed and preview images and videos directly in your research graph
Ideal for microscopy, gel images, experimental setups, or recorded protocols
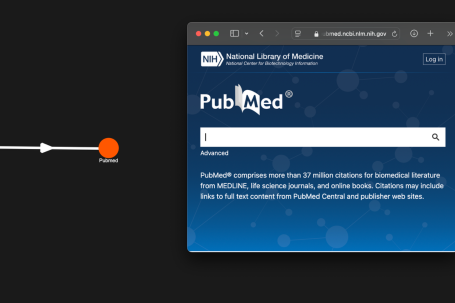
Weblink Nodes
Keep External Resources Connected
Link to journal articles, online tools, or any web resource
Double-click to open directly in your default browser
No more endless tabs and losing track of critical references
Smart Connections Between Data
Build Relationships Between Experiments, Literature & Findings
Highlight key relationships between different aspects of a project
Reduces duplicated experiments & helps track research progress over time
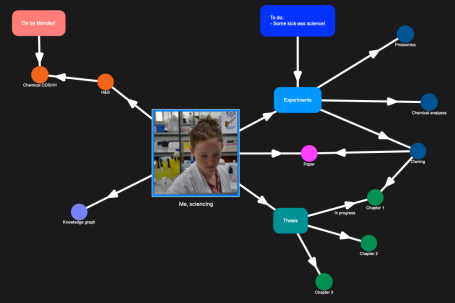
Multi-Level Project Organisation
Organise Research Across Different Levels
Use "Project Nodes" to create sub-projects & nested research levels
Easily navigate up and down between different research layers
Perfect for tracking work over months or years
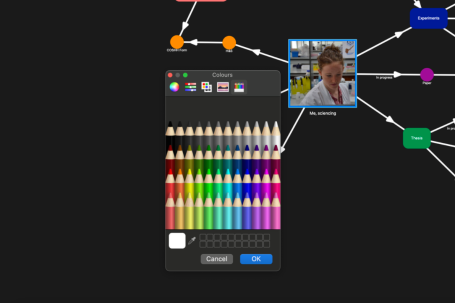
Customisable Interface
Make Your Research Management Work for You
Customise node colours to visually differentiate research elements
Adjust layouts to fit your preferred workflow
A system built for researchers, not just generic project management

© Copyright. All rights reserved.
We need your consent to load the translations
We use a third-party service to translate the website content that may collect data about your activity. Please review the details in the privacy policy and accept the service to view the translations.